RTX Lidar Sensors#
Isaac Sim RTX or Raytraced Lidar supports both Solid State and Rotating Lidar configurations. Each RTX Sensor must be attached to its own viewport to simulate properly.
Warning
Docking windows in the Isaac Sim UI when an RTX Lidar simulation is running will likely lead to a crash. Pause the simulation before re-docking the window.
Note
In Isaac Sim 6.0, RTX Lidar publish rates are governed by the omni:sensor:tickRate
attribute on the OmniLidar prim, not by frameSkipCount on the helper node. For
OmniLidar prims, omni:sensor:tickRate must equal omni:sensor:Core:scanRateBaseHz
for scan accumulation to behave correctly. See Multi-Tick Rendering
for the migration guide and a list of related known issues.
Learning Objectives#
In this example, you:
Briefly introduce how to use RTX Lidar sensors.
Create an RTX Lidar sensor.
Publish sensor data to ROS2 as LaserScan and PointCloud2 messages.
Use the menu shortcut to create RTX Lidar sensor publishers.
Put it all together and visualize multiple sensors in RViz2.
Getting Started#
Important
Make sure to source ROS 2 appropriately from the terminal before running Isaac Sim.
Prerequisites
Completed the ROS 2 Cameras tutorial.
FASTRTPS_DEFAULT_PROFILES_FILEenvironment variable is set prior to launching Isaac Sim and ROS2 bridge is enabled.OPTIONAL: Explore the inner workings of RTX Lidar sensors by reviewing Overview and how to get RTX Sensor Annotators.
Completed the URDF Import: Turtlebot tutorial so that Turtlebot is loaded and moving around.
The optional portion of this tutorial requires the
isaac_tutorialsROS 2 package, which is provided in IsaacSim-ros_workspaces repo.Complete ROS 2 Installation (Default) to make sure the ROS 2 workspace environment is set up correctly.
Note
In Windows 11, depending on your machine’s configuration, RViz2 might not open properly. Some bandwidth-heavy topics might not be available to visualize in RViz2 in WSL.
Adding a RTX Lidar ROS 2 Bridge#
Add a 2D Lidar sensor. Go to Create > Sensors > RTX Lidar > NVIDIA > Example Rotary 2D.
To place the synthetic Lidar sensor at the same place as the robot’s Lidar unit, drag the Lidar prim under
/World/tb3_burger_processed/Geometry/base_footprint/base_link/base_scan. Zero out any displacement in the Transform fields inside the Property tab. The Lidar prim should now be overlapping with the scanning unit of the robot.Add a 3D Lidar sensor. Go to Create > Sensors > RTX Lidar > NVIDIA > Example Rotary.
To place the synthetic Lidar sensor at the same place as the robot’s Lidar unit, drag the Lidar prim under
/World/tb3_burger_processed/Geometry/base_footprint/base_link/base_scan. Zero out any displacement in the Transform fields inside the Property tab. The Lidar prim should now be overlapping with the scanning unit of the robot.Connect the ROS 2 bridge using OmniGraph nodes. Select
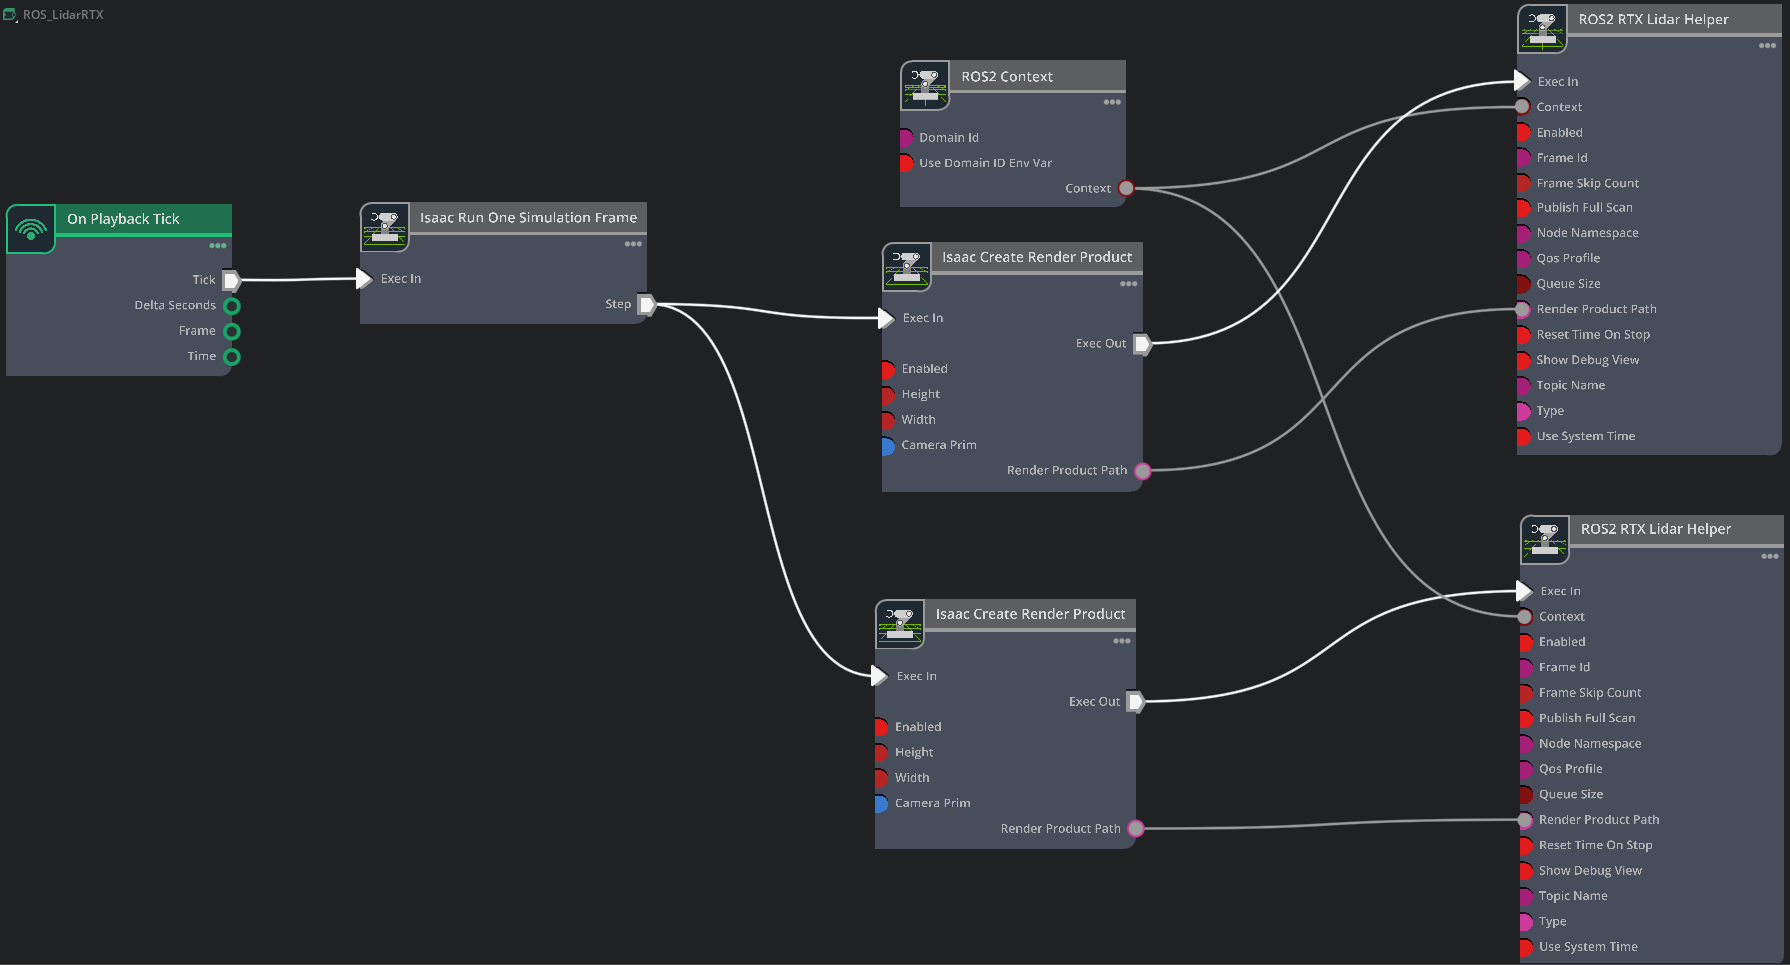
/World/tb3_burger_processed/Geometry/base_footprint/base_link/base_scanin the Stage panel — lidar publisher graphs are tied to a specific sensor, so they belong next to the sensor prim rather than under the robot root. Open Window > Graph Editors > Action Graph, click New Action Graph, and name itROS_LidarRTX. Add the following nodes to the graph:On Playback Tick — triggers downstream nodes when Play is pressed.
ROS 2 Context Node — sets the ROS 2 Domain ID (defaults to 0; check
Use Domain ID Env Varto inheritROS_DOMAIN_IDfrom the launch environment).Isaac Run One Simulation Frame — runs the render-product pipeline once at startup for performance.
Isaac Create Render Product — set
cameraPrimto the 2D Lidar from step 1.Isaac Create Render Product (second instance) — set
cameraPrimto the 3D Lidar from step 3.ROS 2 RTX Lidar Helper — connect the 2D render product output. Set
topicNametoscanandframeIdtobase_scan.ROS 2 RTX Lidar Helper (second instance) — connect the 3D render product output. Set
typetopoint_cloud,topicNametopoint_cloud,frameIdtobase_scan, and check Publish Full Scan.
Note
When type is set to laser_scan in the ROS2 RTX Lidar Helper node, the LaserScan message will only be published when the RTX Lidar generates a full scan.
For a rotary Lidar this is a full 360-degree rotation, while for a solid state Lidar this is the full azimuth of the Lidar, as configured in its profile.
Depending on Lidar rotation rate and time step size, it can take multiple frames to complete the full rotary scan; that is, for render step size 1/60s, a rotary Lidar with
rotation rate 10Hz would take six frames to complete a full scan, meaning the LaserScan message would be published once every six frames. Solid state Lidars
complete the full scan in a single frame, so the corresponding LaserScan message would be published every frame.
PointCloud messages are published either every frame or after the full scan has been accumulated, based on the value of the Publish Full Scan setting in the ROS2 RTX Lidar Helper node.
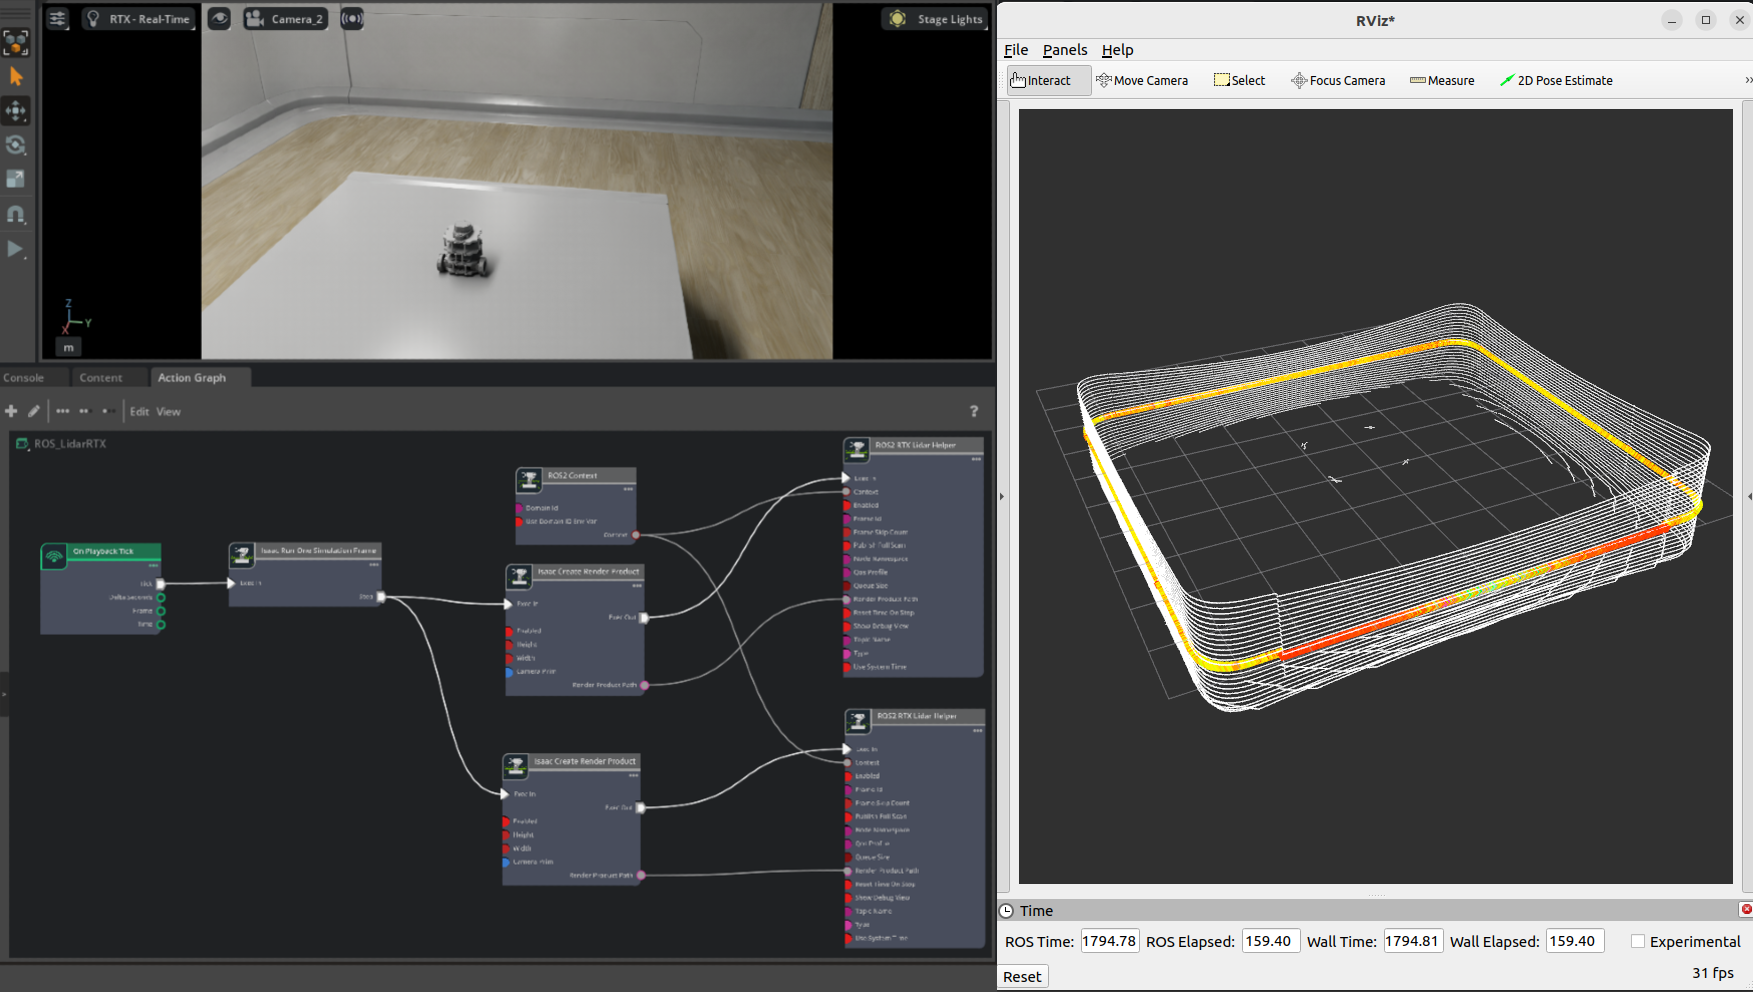
After the graph has been set correctly, hit Play to begin simulation. Verify that the RTX Lidar is sending the LaserScan and PointCloud2 messages and can be visualized in RViz.
For RViz visualization:
Run RViz2 (
rviz2) in a sourced terminal.The lidar frame in Isaac Sim for the RTX Lidar is set to base_scan, update the fixed frame name in RViz accordingly.
Add LaserScan visualization and set topic to /scan.
Add PointCloud2 visualization and set topic to /point_cloud.
Graph Shortcut#
There is a menu shortcut to build multiple Lidar sensor graphs. Go to Tools > Robotics > ROS 2 OmniGraphs > RTX Lidar.
If you don’t observe any ROS2 graphs listed, you need to enable the ROS2 bridge. A popup will appear asking for the parameters needed to populate the graphs. You must provide the Graph Path, the Lidar Prim, frameId, any Node Namespaces if you have one, and check the boxes for the data you want to publish. If you want to add the graphs to an existing graph, check the Add to an existing graph? box. This will append the nodes to the existing graph, and use the existing tick node, context node, and simulation time node if they exist.
Running the Example#
In a new terminal with your ROS2 environment sourced, run the following command to start RViz and show the Lidar point cloud. Replace
ros2_wswithhumble_wsas appropriate.rviz2 -d <ros2_ws>/src/isaac_tutorials/rviz2/rtx_lidar.rviz
Run the sample script:
./python.sh standalone_examples/api/isaacsim.ros2.bridge/rtx_lidar.py
After the scene finishes loading, verify that you observe the point cloud for the rotating Lidar sensor being simulated.
RTX Lidar Script Sample#
While most of the sample code is fairly generic, there are a few specific pieces needed to create and simulate the sensor. In this sample, you create a 2D and 3D RTX Lidar sensor using the isaacsim.sensors.experimental.rtx Python API.
Create the 3D RTX Lidar Sensor:
from isaacsim.sensors.experimental.rtx import Lidar

# Example_Rotary scans at 10 Hz; tick_rate must match scanRateBaseHz so that scan
# accumulation and multi-tick rendering produce a full scan per tick.
lidar = Lidar.create(
    path="/sensor",
    config="Example_Rotary",
    tick_rate=10.0,
    translations=[[0.0, 0.0, 1.0]],
)
Here Example_Rotary selects the 3D Lidar configuration USD. To switch the Lidar to the example solid-state configuration, replace config="Example_Rotary" with config="Example_Solid_State" and update tick_rate to that asset’s omni:sensor:Core:scanRateBaseHz value (see OmniLidar Tick Rate Must Equal scanRateBaseHz).
Create a render product and attach this sensor to it:
import omni.replicator.core as rep

# RTX sensors are cameras and must be assigned to their own render product.
hydra_texture = rep.create.render_product(lidar.paths[0], [1, 1], name="Isaac")
Create the post process pipeline that takes the rendered RTX Lidar point cloud data and publishes it to ROS:
writer = rep.writers.get("RtxLidarROS2PublishPointCloud")
writer.initialize(topicName="point_cloud", frameId="base_scan")
writer.attach([hydra_texture])
Create the 2D RTX Lidar Sensor:
lidar_2D = Lidar.create(
    path="/sensor_2D",
    config="Example_Rotary_2D",
    tick_rate=10.0,
    translations=[[0.0, 0.0, 1.0]],
)
Example_Rotary_2D selects the 2D Lidar configuration USD.
Similar to the 3D Lidar sensor, create a render product and the post process pipeline that publishes the rendered RTX Lidar laser scan data to ROS:
hydra_texture_2D = rep.create.render_product(lidar_2D.paths[0], [1, 1], name="Isaac")

writer = rep.writers.get("RtxLidarROS2PublishLaserScan")
writer.initialize(topicName="scan", frameId="base_scan")
writer.attach([hydra_texture_2D])
Note
For details on additional parameters supported by Lidar.create, including aux_output_level and accumulate_outputs, see RTX Lidar Sensor and the API Documentation.
(Optional) Exposing RTX Lidar Metadata in ROS2 PointCloud2#
RTX Lidar sensors can optionally expose metadata beyond the Cartesian point cloud, including return intensity and timestamp, materials of the objects generating individual returns, and prim paths of the prims generating individual returns. The full list of metadata that can be exposed is described in the IsaacCreateRTXLidarScanBuffer (deprecated) Annotator.
To generate the metadata, you must set the _replicator:rendervar:GenericModelOutput:channels attribute on the OmniLidar prim to include BASIC (or a higher level) - equivalently, construct the prim with Lidar(..., aux_output_level="BASIC") (or higher). See Auxiliary Output Level and the GenericModelOutput RenderVar for how to set the attribute from the Array Properties widget. Some metadata fields require additional carb settings at runtime; refer to the table in the IsaacCreateRTXLidarScanBuffer (deprecated) Annotator documentation.
Isaac Sim must then be configured to write the metadata to the PointCloud2 message. There are multiple ways to do this.
Exposing Metadata through ROS2 OmniGraphs#
Follow the steps in the Adding a RTX Lidar ROS 2 Bridge section to create a RTX Lidar sensor and add the ROS2 OmniGraphs nodes to the action graph. Then:
Stop the simulation if it is running.
Save the scene as a USD.
Close Isaac Sim.
Start or restart Isaac Sim, adding
--/rtx-transient/stableIds/enabled=trueto the run command. This setting enables the RTX renderer to generate the 128-bit Object IDs as part of the RTX Lidar metadata.Reopen the USD you just saved.
Open the visual scripting editor by going to Window > Graph Editors > Action Graph.
Select the action graph you created earlier.
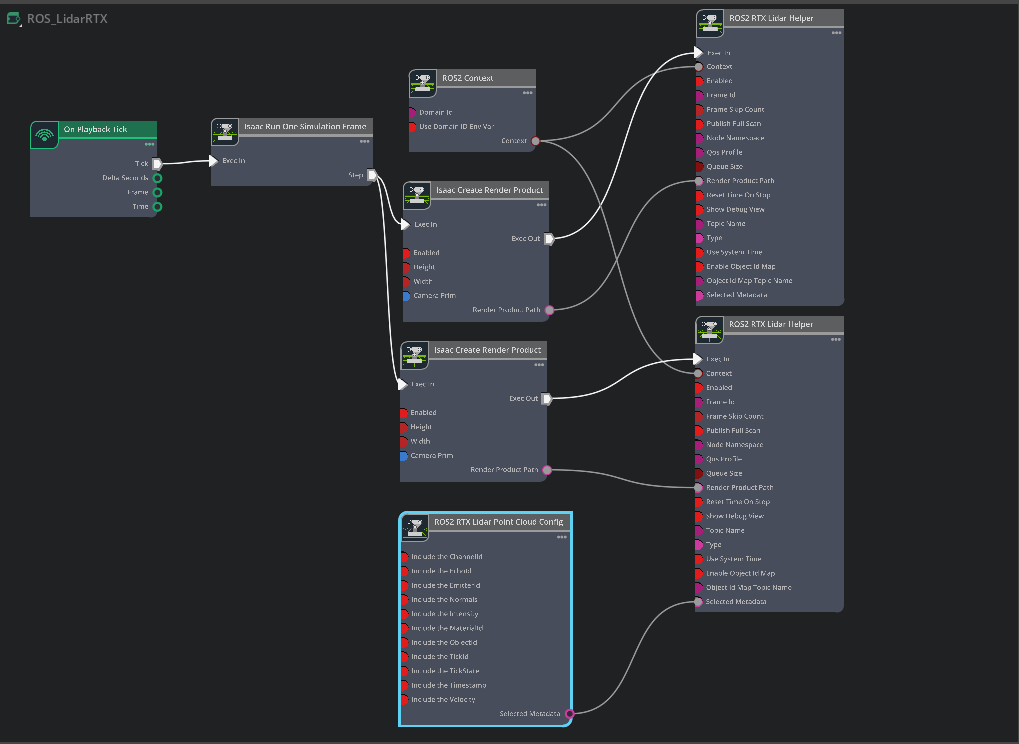
Add a ROS2 RTX Lidar Point Cloud Config node to the graph.
Tick the Include the Intensity and Include the ObjectId checkboxes. This will write the intensity and object ID metadata to the PointCloud2 message.
Connect the
selectedMetadataoutput of the ROS2 RTX Lidar Point Cloud Config node to theselectedMetadatainput of the ROS2 RTX Lidar Helper node for the 3D Lidar sensor.Tick the enableObjectIdMap checkbox on the ROS2 RTX Lidar Helper node for the 3D Lidar sensor. This will enable Isaac Sim to publish a
Stringmessage containing the Object ID map, on the/object_id_maptopic.Tick the enabled checkbox on the ROS2 RTX Lidar Helper node for the 3D Lidar sensor, if not already selected.
Select the Example_Rotary Lidar prim, and set its
_replicator:rendervar:GenericModelOutput:channelsattribute to["FULL"]- see Auxiliary Output Level and the GenericModelOutput RenderVar for the step-by-step Array Properties workflow.Press Play to start the simulation.
For RViz visualization:
Run RViz2 (
rviz2) in a sourced terminal.The lidar frame in Isaac Sim for the RTX Lidar is set to base_scan, update the fixed frame name in RViz accordingly.
Add PointCloud2 visualization and set topic to /point_cloud.
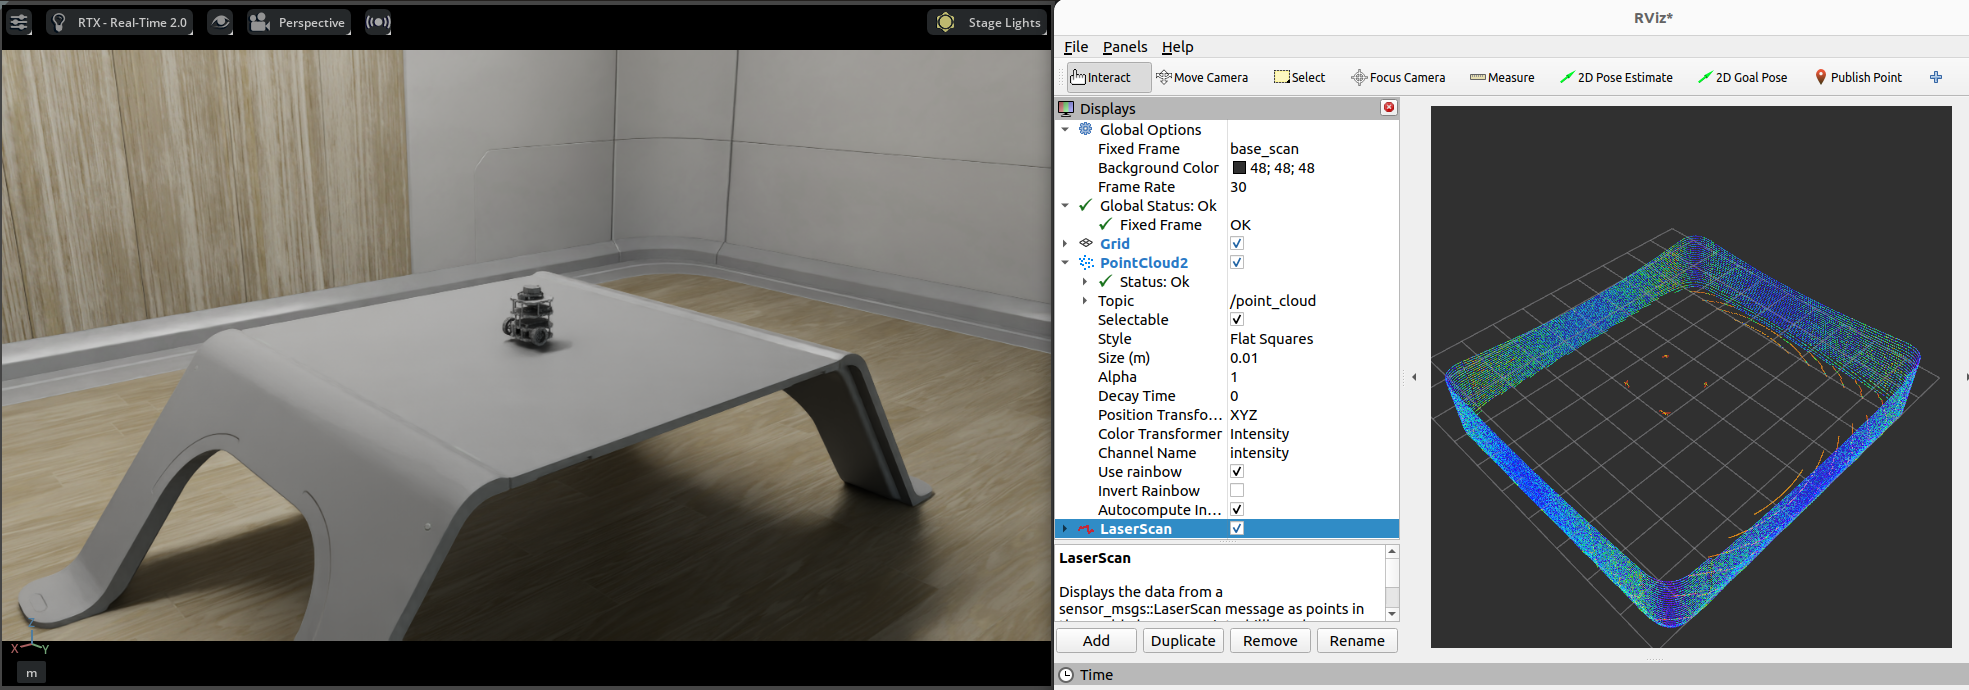
Verify that RViz2 automatically sets the Channel Name under the PointCloud2 visualization to intensity, and the Color Transformer to Intensity,
enabling visualization of the intensity channel in the PointCloud2 message. Most other metadata channels are not visualized by default, except
HitNormal, which when selected will visualize the normal vector of the surface of the object that generated the return.
Exposing Metadata Through Python Script#
Create the 3D RTX Lidar Sensor with aux_output_level="FULL", a render product, and the
RtxLidarROS2PublishPointCloud writer with the output* flags that select which auxiliary
fields end up in the PointCloud2 message:
import omni.replicator.core as rep
from isaacsim.sensors.experimental.rtx import Lidar

# Create an RTX Lidar with FULL auxiliary output level so the GenericModelOutput buffer carries
# every per-point metadata field (intensity, object ID, hit normal, ...). This sets
# ``_replicator:rendervar:GenericModelOutput:channels = ["FULL"]`` on the OmniLidar prim.
lidar = Lidar.create(
    path="/World/sensor_with_metadata",
    config="Example_Rotary",
    tick_rate=10.0,
    aux_output_level="FULL",
    translations=[[0.0, 0.0, 1.0]],
)

# RTX sensors must be assigned to their own render product.
hydra_texture = rep.create.render_product(lidar.paths[0], [1, 1], name="Isaac")

# Attach the RTX-Lidar PointCloud2 writer directly. The ``output*`` flags select which
# auxiliary fields are unpacked from the GMO buffer and written into the PointCloud2 message.
writer = rep.writers.get("RtxLidarROS2PublishPointCloud")
writer.initialize(
    topicName="point_cloud",
    frameId="base_scan",
    outputIntensity=True,
    outputObjectId=True,
)
writer.attach([hydra_texture])

# Publish the Object-ID-to-prim-path map on a separate topic so subscribers can resolve
# returns back to USD prims.
object_id_map_writer = rep.writers.get("ROS2PublishObjectIdMap")
object_id_map_writer.initialize(topicName="object_id_map")
object_id_map_writer.attach([hydra_texture])
The snippet authors _replicator:rendervar:GenericModelOutput:channels = ["FULL"] on the lidar
prim via Lidar.create(..., aux_output_level="FULL"). See
Auxiliary Output Level and the GenericModelOutput RenderVar for the attribute-flow explanation and a known
issue when multiple RTX sensors with different auxiliary levels share a stage.
In addition, specify --/rtx-transient/stableIds/enabled=true when invoking SimulationApp, like so:
from isaacsim import SimulationApp

# Example for creating a RTX lidar sensor and publishing PointCloud2 data
simulation_app = SimulationApp({"headless": False, "extra_args": ["--/rtx-transient/stableIds/enabled=true"]})
When the timeline is played, the PointCloud2 message will be published to the /point_cloud topic with the desired metadata.
Interpreting Timestamp Metadata#
If Timestamp is included in the metadata, the PointCloud2 message will contain
two uint32 fields named timestamp_0 and timestamp_1. These hold the low
and high 32 bits, respectively, of a single uint64 value representing the per-point
timestamp in nanoseconds since the start of the simulation. Reconstruct the
uint64 value as:
# Example: a per-point timestamp pulled from a PointCloud2 message field.
# In a real subscriber you'd read these from points["timestamp_0"] and
# points["timestamp_1"] (uint32 each).
timestamp_0 = 0xCAFEBABE  # low 32 bits
timestamp_1 = 0x12345678  # high 32 bits

# Recombine to a single uint64 nanosecond value.
ts_uint64_ns = (int(timestamp_1) << 32) | int(timestamp_0)
Note
This encoding was introduced in Isaac Sim 6.0. In earlier versions,
timestamp was emitted as a single float32 field (datatype=7, count=1).
Subscribers written against the previous encoding must be updated to read the
two uint32 fields and recombine them.
Interpreting Object ID Metadata#
As described in Semantic Segmentation with RTX Sensor using Object IDs, the Object ID metadata is a stable, unique 128-bit unsigned integer mapping to the prim path of the object that generated the corresponding return.
This can be used for semantic segmentation of the scene, by mapping the object IDs to prim paths and then retrieving semantic labels from the prims. If ObjectId is included in the metadata,
the PointCloud2 message will contain 4 uint32 fields: object_id_0, object_id_1, object_id_2, and object_id_3.
After playing the timeline in one of the examples above, in a new terminal verify that your Isaac Sim ROS workspace is sourced, and run the following node to print the prim paths of the objects generating individual returns:
ros2 run isaac_tutorials ros2_object_id_subscriber.py
Refer to the subscriber script for more details on how to interpret the Object ID metadata. The relevant portion is copied below for reference; it will not run in Isaac Sim Script Editor or standalone Python by itself.
import json

import numpy as np
from rclpy.node import Node
from sensor_msgs.msg import PointCloud2
from sensor_msgs_py.point_cloud2 import read_points
from std_msgs.msg import String


class ROS2ObjectIDSubscriber(Node):
    def __init__(self):

        super().__init__("ros2_object_id_subscriber")

        self.point_cloud2_subscriber = self.create_subscription(
            PointCloud2, "point_cloud", self.point_cloud2_callback, 10
        )
        self.object_id_map_subscriber = self.create_subscription(
            String, "object_id_map", self.object_id_map_callback, 10
        )
        self.object_id_map = None

    def point_cloud2_callback(self, msg: PointCloud2):
        self.get_logger().info(f"Received point cloud.")
        points = read_points(
            msg, field_names=("x", "y", "z", "object_id_0", "object_id_1", "object_id_2", "object_id_3"), skip_nans=True
        )
        if self.object_id_map is None:
            return
        object_ids_as_uint32 = (
            np.stack(
                [
                    points["object_id_0"],
                    points["object_id_1"],
                    points["object_id_2"],
                    points["object_id_3"],
                ],
                axis=1,
            )
            .flatten()
            .reshape(-1, 4)
        )
        object_ids_as_uint128 = [int.from_bytes(group.tobytes(), byteorder="little") for group in object_ids_as_uint32]
        prim_paths = [self.object_id_map[str(i)] for i in object_ids_as_uint128]
        print(prim_paths)

    def object_id_map_callback(self, msg: String):
        self.get_logger().info(f"Received object id map: {msg.data}")
        self.object_id_map = json.loads(msg.data)["id_to_labels"]
Summary#
This tutorial covered creating and using the RTX Lidar Sensor with ROS2:
Adding a RTX Lidar sensor.
Adding a RTX Lidar and PointCloud ROS2 nodes.
(Optional) Exposing RTX Lidar metadata (intensity, Object IDs, timestamps) in the published PointCloud2 message.
Next Steps#
Continue on to the next tutorial in our ROS2 Tutorials series, ROS2 Transform Trees and Odometry, to learn how to add global and relative transforms to a transform tree.
Further Learning#
Explore the inner workings of RTX Lidar sensors by learning Overview and how to get RTX Sensor Annotators.
Auto-generated topic namespaces driven by the lidar prim path (via
renderProductPath) are covered in Automatic ROS 2 Namespace Generation.